I am a part of the team which is responsible for management and hedging of commodities exposures. Some say corporates are good only in following advice from banks or brokerages. I do agree corporates do not have market insight of a bank. But here is a problem. It is not bank or broker or a hedge fund that has biggest risk that markets will go against them. These guys always have an option to do nothing and wait for a better trading opportunity where as we don't. We have to continue to purchase commodities, spend currencies for daily business. Such company is always exposed to changes to market price even if it decides not to hedge. In fact my company has probably one of the biggest short commodities portfolio in the world. Managing such risk effectively is a challenge. It is like being between a rock and a hard place. You get your behind kicked all the time be senior management, whether it was a missed opportunity to hedge or hedge that turned to be out of the money. Critics will say if you lost money on your hedge then you probably bought it cheaper on physical market. let's face it, nobody wants to loose money, full-stop.

So I do not have an option to do nothing as I am always in the position (short in this case). I think people like me have higher motivation to earn positive return on their portfolio then other players. In fact my intention is to bring hedging to a performance benchmark of proprietary trading.

Search This Blog

Friday, July 16, 2010

Follow up on NYMEX gas

Well, last time I spoke about NYMEX gas I speculated whether head and shoulder pattern was to materialise. To my surprise it did and price fell sharply towards long term support line:

I was almost convinced that the fall through this support line and all the moving averages would send the market seeking value at zero, when I got another surprise. this what happens when everyone is short the market. relatively in-line-with-forecast storage build sent prices more then 6% higher on the day. So I will try to make another bullish case for natural gas.

While it is too early to say that new trend is developing as we continue trading in the bearish channel, rally off 4.30 is a supportive one. I give more preference to support/resistance lines that have proven to hold  over time so I think we saw a bottom at 4.29-4.30 for the time being. Ideally I would like to see this market forming a base off the support line, similarly to what it did in March-May this year and then break higher. However in view of recent market volatility in other risk assets I would not be surprised to see some strong short covering rallies as speculators try to fund their other positions.

All in all I still believe we are in for test of channel resistance at $8+ over long term. Risk is that if we see new low market can collapse towards this decade lows at $2.

A different approach - what could earnings season bring us? PART 5

It looks like I missed GE earnings today, but there was nothing new there:


we have seen lower high and  momentum turns down, so further losses are likely. Same as with every other DJIA component I looked at so far.

IBM is the next one to report next week. Remarkably this must have been the strongest performer in the index as it had been mostly trading sideways for the last 9! months! Here is the chart:


Obviously range trading means price is going nowhere and given the length of range trading, earnings can cause significant moves if range is broken. So this will be an interesting one to see. While momentum suggests we can test 127 area where currently most of the averages are, there is obviously no trend and it will be difficult to speculate on further direction from there. I would prefer to look at the pre earnings day trading to suggest further direction.

Happy weekend everyone!

Thursday, July 15, 2010

Something's gotta give

I have called on possible recovery rally in risk assets two weeks ago as price action in FX markets showed divergence from regular risk on/risk off relationship. Reassessing the markets now and talking to other market participants the risk relationship looks more and more confusing as dollar falls along with falling equity and commodity prices. I will stick to the idea that this divergence is temporarily unless market starts talking deflation louder in the coming weeks (see my post in the beginning of July on this).

Here is what I am looking at:

1. Earnings season has been disappointing so far. see all my posts titled "A different approach - what could earnings season bring us?"
2. I see lower highs in commodities with momentum turning lower as well. Other technical formations support further downside. Oil is a good example:


Copper  as well:

3. Rebound in JPY was shortlived as well and further downside is likely:
4. The star of the pack is Euro:

Given the above I do not believe strength in Euro will persist and I think it will soon join the rest of the pack, probably around these levels or close to 100d moving average and slightly short of H&S target. Watch Euro carefully as if it rolls over taking into account that other markets are vulnerable to downside then things can get nasty.

What can make me change my mind? Only if I see multiple break outs above recent highs. Nevertheless risk/reward is more beneficial for risk off trades... happy trading!

A different approach - what could earnings season bring us? PART 4

As expected JPMorgan price action had been similar to other DJIA components who published their earnings already - gap higher on the open then trade on the lows of the day. Not to mention that these companies are trading lower then their pre earnings level. This is consistent with the idea of further losses in equity and other risk assets. moreover JPM looks like it will post an outside day bearish formation:


Tomorrow it will be Bank of America before US open... It is reasonable to expect similar price action... Here is the chart:

It is important to mention that momentum for most of the stocks is turning down in the overbought area of stochastic oscillator. Coupled with lower high on most of the charts this is a bearish development...

A different approach - what could earnings season bring us? PART 3

I continue on my follow up of the earnings releases in DJ Industrial Average and price set upbefore and after earnings. So far:
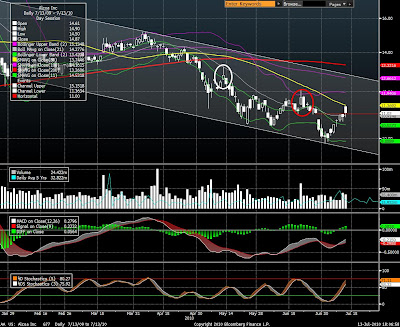
1 Alcoa - sell. Two other blow out tops on above average volume resulted in new lows for the year. Difficult to find the down trend.
2 Intel - neutral going forward. Market gapped through 50d moving average, but closed at the lows of the day. Difficult to justify either up or down trend. An interesting read from CNBC: http://www.cnbc.com/id/38244083

3rd to report will be JPMorgan. It has similar set up as Intel post earnings:


We broke out of the downward channel which is in itself bullish development, however low volume remains a problem for a bullish case. After the performance of the first two companies that published the results it is more likely we will see similar price action - if results are good we will gap higher, but finish on the lows of the day.

Wednesday, July 14, 2010

Fwd:Could tomorrow's retail sales kill faith in the recovery

--- Original Sender: KEVIN O'DOWD, STIFEL NICOLAUS & CO ---


----- Original Message -----
From: KEVIN O'DOWD (STIFEL NICOLAUS & CO)
At: 7/13 14:37:39

Great read from Julian Brigden at Credit Agricole...

It's not hard to believe that the correlation between NFP and initial claims has been over 75% over the last 27 years. However, that's what made the massive divergence we'd seen since December so odd. NFP was exploding higher implying claims in the 300K range and yet they remained depressingly flat at 450k. Well on the 2nd the headline NFP number plunged from +433k to -125k and in one month we re-established the relationship (jpg 1) with claims. The timing of the drop, which coincided with the end of census jobs, seemed to explain the reason
divergence although as I pointed out at the time it's a little odd we'd never seen these type of divergences in 1990 or 2000 i.e. other census years.

This massive one month drop didn't worry the market unduly at the time because we were braced for a fall in the headline and were focused instead on the private sector job creation. However, it's this headline no. that most interests me when it comes to retail sales. The reason is simply that I follow a very simple rule when I look at American consumers 'if they have it, they spend it'. Indeed, I think its fair to assume that census workers who this year were heavily drawn from the ranks of the unemployed or students almost certainly have the highest marginal propensity to consume amongst any workers. So bottom line I think we are going to see the fall in jobs materially impact retail sales especially, as the correlation between YoY retail sales growth and
NFP since 1993 is 82% as you can see below. What I particularly like about this chart is that as NFP headline has recovered retail sales have followed tick for tick driving the 5yr correlation to just under 92%. So now NFP has dropped so hard how far could retail sales fall?

Well the chart (jpg2) suggests if we see retail sales follow the same precipitous one month drop of NFP, the YoY rate should drop from last months 6.9% to ZERO. Last June the index of retail sales was 343.1 vs. last month's 362.52 so zero YoY would mean that the monthly rate, expected to print -0.3% on Wednesday would in fact print -5.4%. Now that frankly seems like an inconceivable no. as it would be the worst number we've seen since the series started in 93. However, I have to think that even if we make up the divergence over a couple of months something like -2% tomorrow would cause people to fundamentally question the recovery. Personally, I think all we are doing is remove a lot of the noise created in the data by the census jobs and we should see retail sales drop back to the levels suggested by claims (jpg3) and possibly even the ABC consumer buying climate question (jpg3). Unfortunately, that should cause people to question the recovery!

In terms of trades I believe this would trigger full scale risk off! On that basis I'd suggest taking a look at my 7 longer term risk off trades, which updated for the latest data suggest:


1) 30yr fair value is 3.3%

2) S&P = 875 and is 18% overvalued

3) $/KRW = 1400 and is 16% undervalued

4) $/MXN = 14.25 ie 11% undervalued

5) NZD TWI 112.00 using CEERNZD index ie 8.5% overvalued

6) $/ZAR = 10.00 this is a favourite as it's 30% undervalued. Also
now the World Cup is over flows should abate and the domestic economy is
already weak and the central bank is cutting

7) BMW stock to 25 Euro's from today's 41+...PS you could do a
basket of auto stocks

Tuesday, July 13, 2010

A different approach - what could earnings season bring us? PART 2

Market reaction to Alcoa earnings today is different to the overnight trading and broader market continues to rally into earnings season. Alcoa gapped as high as 11.34 on the open following yesterdays earnings release. But the market was quick enough to fall towards 11 again and is trading on the lows of the day. on two other occasions this resulted in new low for the year:


Dow is up 1.5% and most of its components are trading higher. Tonight it is Intel's turn. While the market managed to push through downward channel, there is still 50d moving average at 21.05 acting as resistance now. Everyone is fond of tech stocks, but technically this market has little potential to rally under 50d moving average. I will change my view if we break it though. Here is the chart:

Looks like there is lots of uncertainty for the risk assets, but looking at most of the charts, any advances still should be treated as correction rather then the upward trend.

Monday, July 12, 2010

A different approach - what could earnings season bring us?

This time, without looking at macro picture, I will have a look inside major variable that has been driving equities and commodities markets or risk assets recently - earnings. It is difficult to analyse every company in S&P, so I will focus on Dow Jones instead. First company to report in DJ Industrial average is Alcoa:

Honestly I have no idea what the fundamentals of this company are. I only know that price of aluminium at LME was under pressure since the beginning of this year. and obviously the revenues of this company very hit. Is it a sell ahead of earnings? I am afraid so. Recovery off  $10 psychological support, despite beeing a decent one in % terms, occurred on low volume. That means it was more of a short covering rally rather then new longs being established. Moreover the rally was not strong enough to push the share above the gap (10.75-11) and we reversed off it. So the market is not putting strong conviction on earnings of this company. Under $11 it is a sell, but only when momentum confirms this or we turn lower after consolidation.

I will go ahead a little bit and look at the next company - Intel. Everyone says they like tech companies:


Well, everyone, but not the market... a series of lower highs this year confirms the down trend. This equity probably would need something very big to break past $21 (channel resistance, 50d and 200d moving averages). Volume off the lows is not encouraging either. As for Alcoa, if momentum turns bearish under $21 its a sell.


Situation looks different for JPMorgan however:


despite lower volume the market managed to break the channel and is now testing 50d moving average. IF broken, next target is 41.5 - convergence of 100 and 200d moving averages.

so for the remainder of the week the strategy is the following: sell ahead of and tech and buy ahead of financials... happy trading everyone!